- 2024-02-01T00:00:00
- Company Research
- VIC announced 2023 results with revenue of VND161.6tn (USD6.7bn; +59% YoY) and NPAT-MI of VND2.06tn (USD85mn; -77% YoY), fulfilling 91% and 100% of our respective forecasts. We foresee an insignificant change to our 2024F NPAT-MI forecast, pending a more comprehensive review.
- VIC’s 2023 bottom-line result was mainly supported by 1) strong property sales and retail leasing segments and 2) other gains resulting from the Chairman’s grants of VND20.6tn/USD848mn to VinFast (Nasdaq: VFS).
- Property sales and retail leasing segments: Please find more details in our January 30 VHM Earnings Flash, and January 30 VRE Earnings Flash.
- Hospitality segment: The YoY improving result in 2023 was in line with our expectation. The segment’s 2023 revenue was VND8.96tn (USD369mn; +33% YoY) and EBIT loss was VND4.9tn (USD202mn) vs the 2022 EBIT loss of VND5.9tn (USD242mn).
- Industrial segment: The segment’s 2023 revenue (VND28.4tn/USD1.2bn; +2.2x YoY) and EBIT loss (VND33.5tn/USD1.4bn) surpassed our respective forecasts by 17% and 14%, mainly due to higher EV deliveries in Q4 2023 vs our projection (VinFast delivered over 34,800 EV units in 2023 vs our projection of 30,000 units).
- Capital raising: Per management, VIC has raised around VND78tn (USD3.2bn) of funding in 2023 excluding revolving loans, which includes (1) USD239mn of VFS’s proceeds from the de-SPAC process, and investment from VFS’s strategic investor Gotion Inc., (2) grants from the Chairman (VND20.6tn/USD848mn in 2023), (3) new bond issuances (VND15.4tn/USD634mn domestic bonds, and USD250mn exchangeable bonds), and (4) bank borrowings and convertible debenture. In addition, VIC was granted a credit line of total VND70tn (USD2.9bn) from commercial banks by end-2023.
- Per management, VIC continues to look for various capital raising plans, including (1) tapping domestic markets (such as domestic bond offerings and domestic bank financing), (2) international debt financing, (3) accessing equity capital markets, particularly in the US for VFS, (4) Chairman’s grants (including net proceeds from the upcoming sales of VFS shares), and (5) opportunistic divestment of select assets.
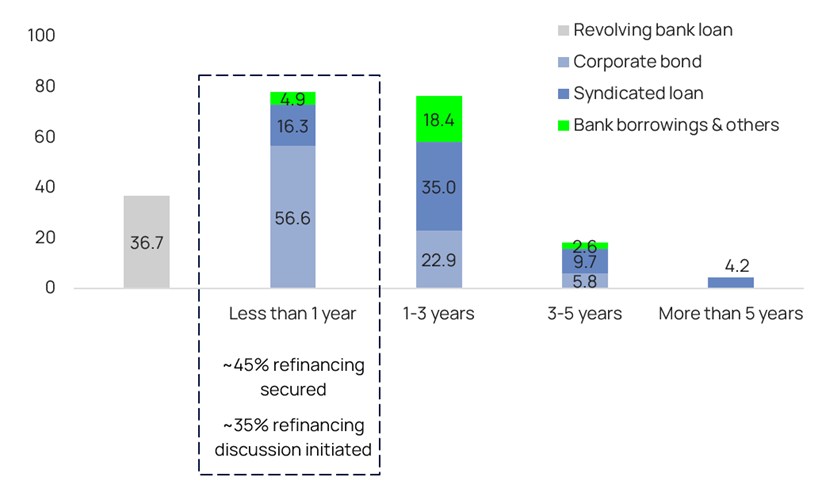
- Debt balance: As of end-2023, VIC’s total debt was VND213tn (USD8.8bn), with USD-denominated debts accounting for 42.2% of total debt. Debts maturing within 12 months included (1) revolving bank loans of VND36.7tn (USD1.5bn), and (2) corporate bonds, and other loans amounting to VND77.7tn (USD3.2bn; in which ~45% are secured for refinancing and ~35% in discussion for refinancing, per management).
- If excluding VHM and VRE, VIC’s long-term loans and bonds set to mature within 12 months as of end-2023 were VND66.6tn (USD2.7bn), in which corporate bonds were VND52tn (USD2.1bn; including a total of USD1.3bn from three exchangeable bonds/EBs having the right to redeem in the next 12 months alongside the right to exchange into listed shares) and syndicated loans were VND13tn (USD551mn).
Figure 1: VIC’s 2023 results
VND bn | 2022 | 2023 | YoY% Growth | 2023F | 2023 as % of 2023F |
Net revenue | 101,794 | 161,634 | 59% | 177,267 | 91% |
| 54,921 | 94,320 | 72% | 115,319 | 82% |
| 7,669 | 9,125 | 19% | 7,949 | 115% |
| 6,724 | 8,962 | 33% | 9,145 | 98% |
| 13,058 | 28,421 | 118% | 24,248 | 117% |
| 19,421 | 20,806 | 7% | 20,606 | 101% |
|
|
|
|
| |
EBIT | -10,631 | -3,126 | N.M. | 8,482 | N.M. |
| 26,293 | 27,874 | 6% | 37,950 | 73% |
| 3,718 | 4,810 | 29% | 4,613 | 104% |
| -5,889 | -4,909 | N.M. | -4,965 | 99% |
| -32,892 | -33,471 | N.M. | -29,275 | 114% |
| -1,861 | 2,570 | N.M. | 159 | 1613% |
|
|
|
|
|
|
Financial income | 33,048 | 21,197 | -36% | 18,473 | 115% |
Financial expenses | -14,326 | -22,518 | 57% | -21,211 | 106% |
Net other gain (loss) | 4,751 | 18,225 | 284% | 7,000 | 260% |
PBT | 12,756 | 13,681 | 7.3% | 12,745 | 107% |
Tax expenses | -10,711 | -11,630 | 9% | -12,634 | 92% |
PAT | 2,044 | 2,051 | 0% | 111 | 1842% |
Minority interest | -6,738 | -12 | N.M. | -1,943 | 1% |
NPAT-MI | 8,782 | 2,063 | -77% | 2,054 | 100% |
|
|
|
|
|
|
EBIT margin | -10.4% | -1.9% |
| 4.8% |
|
| 48% | 30% |
| 33% |
|
| 48% | 53% |
| 58% |
|
| -88% | -55% |
| -54% |
|
| -252% | -118% |
| -121% |
|
|
|
|
|
|
|
PBT margin | 12.5% | 8.5% |
| 7.2% |
|
PAT margin | 2.0% | 1.3% |
| 0.1% |
|
Effective tax rate | 84.0% | 85.0% |
| 99.1% |
|
NPAT-MI margin | 8.6% | 1.3% |
| 1.2% |
|
Source: VIC’s consolidated financial statements, Vietcap forecast (updated November 17, 2023)
Figure 2: VIC’s total debt breakdown by maturity (VND tn) as of end-2023
 Source: VIC, Vietcap
Powered by Froala Editor