- 2024-01-31T00:00:00
- Company Research
PLX released its Q4 2023 results with revenue of VND68.7tn (-12% YoY) and reported NPAT-MI of VND641bn (-44% YoY). The YoY decrease in Q4 2023 reported NPAT-MI is mainly due to (1) a 13% YoY decrease in sales volume following 2022’s high base, coupled with (2) a 4% YoY increase in SG&A expense due to rising labor costs (+8% YoY) and +7% increase in outsourcing & land renting costs). These factors outweigh the improvement in gross profit margin by 0.3 ppts YoY, and a write-back of VND765bn for an inventory provision in Q4 2023.
Official NPAT is 10% higher than the preliminary 2023 number. In 2023, revenue was VND274.3tn (-10% YoY) and reported NPAT-MI was VND2.8tn (+94% YoY). The strong growth in NPAT-MI is mainly due to (1) gross profit margin increasing by 1.5 ppts YoY thanks to stable petroleum prices in 2023 compared to volatile prices in most of 2022 and (2) a 41% YoY surge in financial income from the PGB divestment gain.
For full year 2023, PLX’s revenue and reported NPAT-MI completed 109% and 92% of our respective forecasts, which slightly trails our expectations. Therefore, we foresee a slight downside risk to our 2024 earnings forecast. We attribute the lower-than-expected reported NPAT-MI to (1) 4% lower-than-expected sales volume and (2) 5% higher-than-expected SG&A expense. The sales volume performance is disappointing given the 9M sales volume growth of 3% YoY. The 1% YoY decline in sales volume is due to a 15% YoY decrease in sales volume from wholesales & industrial clients, which outweighs the 7% YoY increase in retail sales volume supported by PLX continuing to take market share from smaller players in 2022.
Figure 1: PLX’s 2023 results
VND bn | Q4 2022 | Q4 2023 | YoY | FY 2022 | FY 2023 | YoY | % of Vietcap’s 2023F |
Brent oil price (USD/bbl) * | 89 | 83 | -7% | 99 | 82 | -17% | 99% |
Gasoline price (VND/liter) * | 21,438 | 21,997 | 3% | 25,057 | 21,995 | -12% | 114% |
Diesel price (VND/liter) * | 23,625 | 21,190 | -10% | 23,793 | 20,526 | -14% | 109% |
Domestic sales volume (mn m3) | 2.9 | 2.5 | -13% | 10.4 | 10.3 | -1% | 96% |
Revenue | 78,367 | 68,656 | -12% | 304,064 | 274,253 | -10% | 109% |
Gross profit | 4,283 | 3,982 | -7% | 12,320 | 15,252 | 24% | 102% |
Selling expense | -3,178 | -3,252 | 2% | -10,500 | -12,128 | 16% | 105% |
G&A expense | -240 | -299 | 25% | -823 | -941 | 14% | 111% |
Operating profit | 865 | 431 | -50% | 997 | 2,183 | 119% | 86% |
Financial income | 937 | 606 | -35% | 1,949 | 2,741 | 41% | 104% |
Financial expenses | -577 | -357 | -38% | -1,706 | -1,722 | 1% | 97% |
Interest expenses | -165 | -215 | 30% | -644 | -904 | 40% | 98% |
Profit/(loss) from JVs, associates | 148 | 119 | -19% | 703 | 600 | -15% | 80% |
PBT | 1,656 | 850 | -49% | 2,270 | 3,932 | 73% | 92% |
Income tax | -252 | -86 | -66% | -368 | -880 | 139% | 113% |
NPAT-MI, reported | 1,137 | 641 | -44% | 1,450 | 2,812 | 94% | 92% |
|
|
| ppts |
|
| ppts |
|
Gross profit margin % | 5.5% | 5.8% | +0.3 | 4.1% | 5.6% | +1.5 |
|
Sales & marketing % sales | 4.1% | 4.7% | +0.7 | 3.5% | 4.4% | +1.0 |
|
General admin % sales | 0.3% | 0.4% | +0.1 | 0.3% | 0.3% | +0.1 |
|
EBIT Margin | 1.1% | 0.6% | -0.5 | 0.3% | 0.8% | +0.5 |
|
NPAT-MI margin | 1.5% | 0.9% | -0.5 | 0.5% | 1.0% | +0.5 |
|
Source: PLX, Vietcap (*average prices)
Figure 2: Platts Singapore price movement (reference point for Vietnamese petroleum retail prices), excluding the impact of the petroleum stabilization fund (USD/bbl)
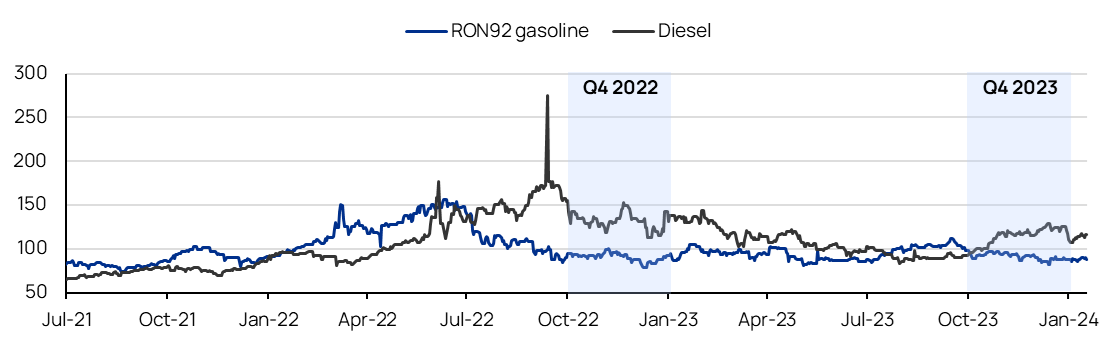
Source: Ministry of Industry and Trade, Vietcap (data as of January 17, 2024)
Figure 3: Vietnamese E5 gasoline and diesel retail prices, including the impact of the petroleum stabilization fund (VND/liter)
|
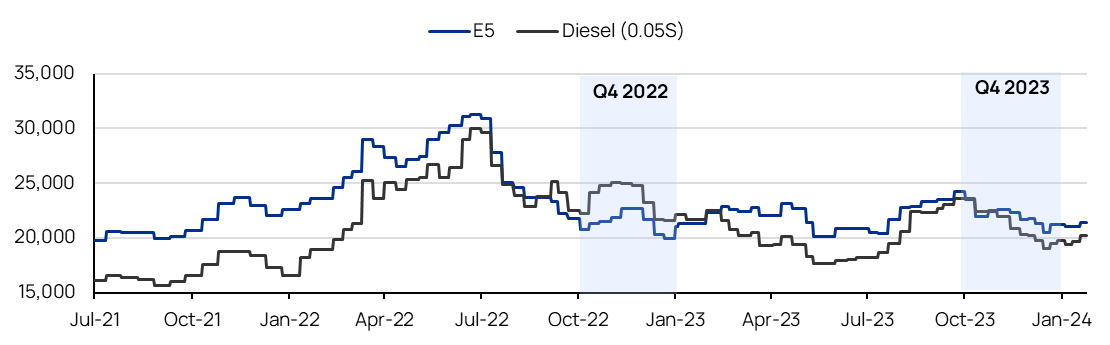
Source: PLX, Vietcap (data as of January 17, 2024)
Powered by Froala Editor