- 2024-10-31T00:00:00
- Company Research
- BSR released its Q3 2024 results with revenue of VND31.9tn (-15% YoY) and reported a net loss of VND1.2tn (vs reported NPAT-MI of VND3.3tn in Q3 2023). The YoY drop was mainly due to (1) lower YoY average crack spreads (the difference between output prices and input prices), and (2) BSR made an inventory provision of VND82bn in Q3 2023 to factor in the oil price decreasing by 5% QoQ during Q3 2024. These factors outweighed (3) a 9% YoY increases in sales volume, following efficiency increasing after the fifth turnaround of BSR’s refinery.
- In 9M 2024, revenue was VND87tn (-17% YoY) and reported NPAT-MI was VND715bn (-89% YoY). These YoY decreases were mainly due to (1) 11% YoY lower sales volume due to the fifth turnaround in H1 2024, along with a (2) 6.4 ppts drop YoY in GPM due to YoY lower average crack spreads.
- 9M 2024 reported NPAT-MI was lower than our expectations, completing 14% of our full-year forecast, which we attribute to BSR’s high input costs. Despite our expectation for higher earnings in Q4, we foresee downside risk to our 2024 earnings forecast, pending a fuller review. Higher earnings in Q4 should be supported by (1) improving profitability, bolstered by an expected improvement in crack spreads in Q4 vs Q3 (Figure 2), and (2) YoY higher sales volume as BSR’s refinery will operate at full utilization and increase its efficiency rate up to 114%.
- We currently have an OUTPERFORM rating for BSR with a target price of VND27,400/share.
Figure 1: BSR’s 9M 2024 results
VND bn | Q3 2023 | Q3 2024 | YoY | 9M 2023 | 9M 2024 | YoY | % of Vietcap’s 2024F |
Brent oil price (USD/bbl) * | 86 | 79 | -8% | 82 | 82 | 0% | 102% |
Sales volume | 1,772 | 1,930 | 9% | 5,271 | 4,673 | -11% | 75% |
Revenue | 37,756 | 31,945 | -15% | 105,491 | 87,058 | -17% | 70% |
COGS | -33,925 | -33,415 | -2% | -98,411 | -86,774 | -12% | 73% |
Gross profit | 3,831 | -1,470 | N.M. | 7,080 | 284 | -96% | 5% |
Sales and marketing expenses | -176 | -164 | -7% | -678 | -438 | -35% | 47% |
General and admin expenses | -137 | -129 | -6% | -383 | -385 | 0% | 72% |
Operating profit | 3,518 | -1,763 | N.M. | 6,019 | -538 | -109% | -14% |
Financial income | 419 | 554 | 32% | 1,700 | 1,820 | 7% | 72% |
Financial expense | -318 | -125 | -61% | -803 | -520 | -35% | 66% |
Profit before tax | 3,621 | -1,330 | N.M. | 6,939 | 782 | -89% | 14% |
NPAT-MI reported | 3,261 | -1,210 | N.M. | 6,232 | 715 | -89% | 14% |
|
|
|
|
|
| Δ ppts |
|
GPM | 10.1% | -4.6% | -14.7 | 6.7% | 0.3% | -6.4 |
|
SG&A %sales | 0.8% | 0.9% | +0.1 | 1.0% | 0.9% | -0.1 |
|
EBIT Margin | 9.3% | -5.5% | -14.8 | 5.7% | -0.6% | -6.3 |
|
Reported NPAT-MI Margin | 8.6% | -3.8% | -12.4 | 5.9% | 0.8% | -5.1 |
|
Source: BSR, Vietcap (*average prices)
Figure 2: Platts Singapore Diesel Oil (DO) and gasoline spreads (vs Brent) (USD/bbl)
|
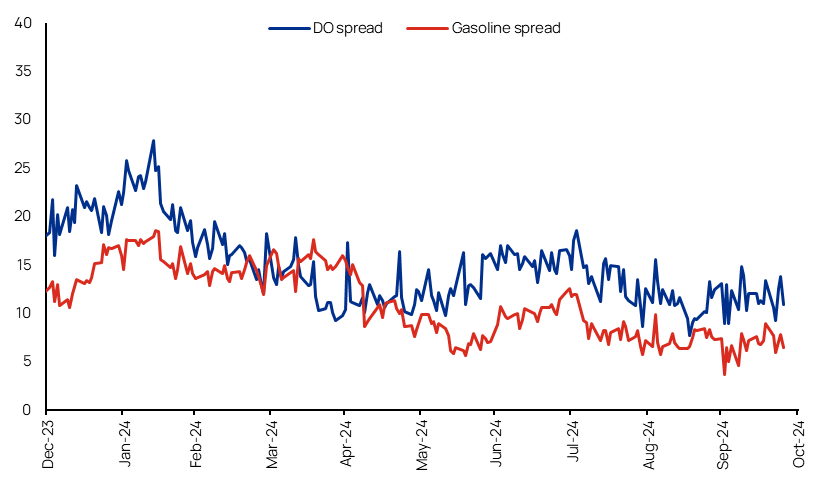
Source: BSR, Bloomberg, Vietcap
Powered by Froala Editor